

Initially, companies have spent years collecting employee information, but without a skills graph, this data often remains disconnected. Specifically, they know job titles, departments, years of experience, certifications, and performance ratings. Yet, many organizations still struggle to answer simple questions:
-
Who has the skills needed for our next project?
-
Which employees can move into critical roles?
-
What skills will we need next year?
-
Where are our biggest skill gaps?
Consequently, as a Jobs and Skills Architecture Consultant, I’ve found that the problem isn’t usually a lack of data. Rather, it’s that the data exists in separate systems that don’t connect. For instance, HR has one view, while Learning and Development has another; similarly, recruiters use different information, and business leaders often rely on guesswork.
Therefore, this is where a skills graph changes everything.
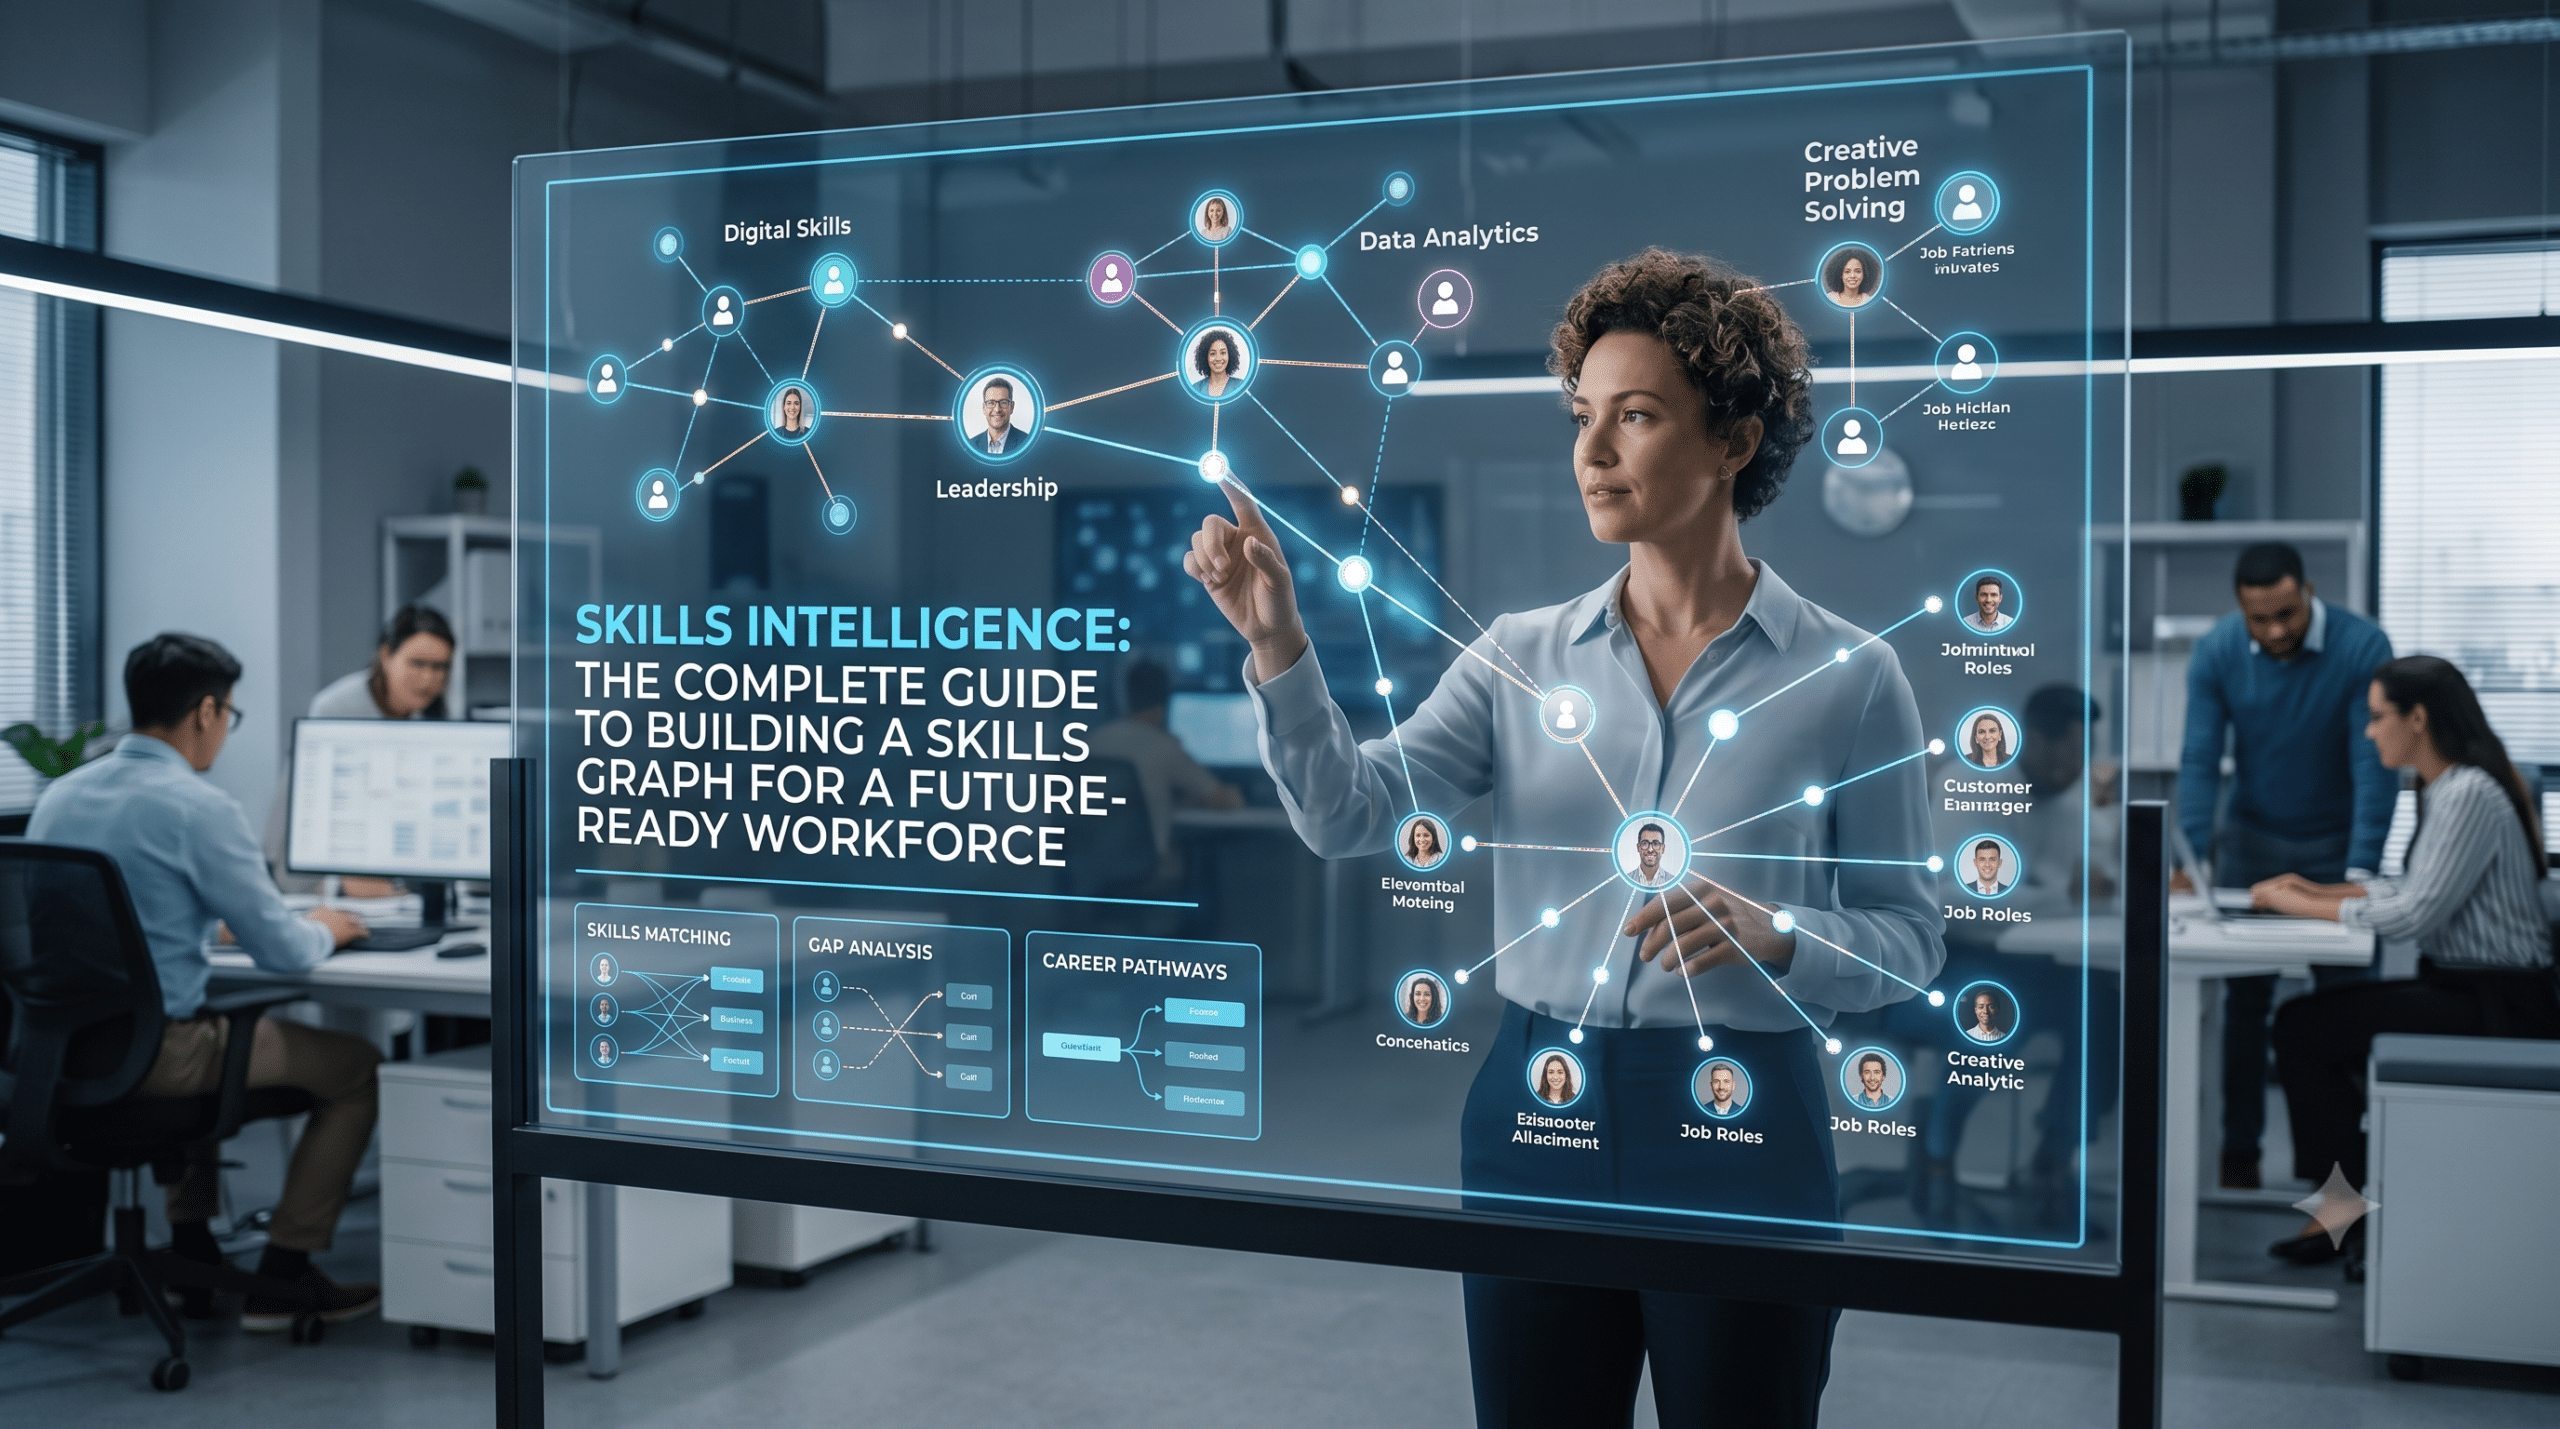
Instead of treating skills as isolated keywords on resumes or job descriptions, a skills graph connects skills, jobs, learning content, certifications, projects, business functions, and employees into one intelligent network. As a result, the outcome is a much clearer understanding of workforce capabilities and future talent needs.
Furthermore, organizations investing in Skills Intelligence are moving beyond traditional workforce planning. Indeed, they’re creating living talent ecosystems that continuously evolve as employees learn new capabilities, industries change, and technology advances.
In this guide, I’ll explain what a skills graph is, why it matters, and subsequently, outline the 11 practical ways organizations can use it to improve hiring, workforce planning, employee development, and internal mobility.
What Is a Skills Graph?
Fundamentally, a skills graph is a connected map of relationships between skills, jobs, people, certifications, learning programs, projects, and business capabilities.
Unlike a spreadsheet that simply lists skills, a skills graph understands how everything relates. For example, consider this capability chain:
-
Python connects to Data Science.
-
Next, Data Science connects to Machine Learning.
-
Then, Machine Learning connects to AI Engineering.
-
Subsequently, AI Engineering connects to Cloud Architecture.
-
Finally, Cloud Architecture connects to DevOps.
Consequently, instead of seeing separate skills, the organization sees an entire capability network.
To illustrate, imagine Google Maps. Initially, Google Maps doesn’t just show cities. More importantly, it shows how roads connect them. Likewise, a skills graph works the exact same way. Specifically, it shows how knowledge, experience, and job roles connect throughout an organization.
What Is Skills Intelligence?
Essentially, Skills Intelligence is the ability to collect, organize, analyze, and use workforce skills data to make better talent decisions. Rather than relying only on resumes or job titles, Skills Intelligence identifies what people can actually do. Thus, it helps organizations answer questions such as:
-
Which employees already possess emerging technical skills?
-
Who can transition into new roles with minimal training?
-
Which departments have overlapping capabilities?
-
Which skills are becoming outdated?
-
What learning investments will have the greatest impact?
Moreover, when powered by a skills graph, Skills Intelligence becomes significantly more accurate. This is because relationships between skills are continuously analyzed instead of being treated as isolated data points.
Why Traditional Job Titles No Longer Work
Historically, for decades, companies organized employees by job titles. For instance, examples include:
-
Marketing Manager
-
Software Engineer
-
HR Specialist
-
Sales Representative
While useful for payroll and organizational charts, job titles reveal very little about actual capabilities. To demonstrate, consider two Software Engineers. On one hand, one may specialize in:
-
Python
-
Kubernetes
-
AWS
-
Terraform
On the other hand, another may specialize in:
-
Java
-
Oracle
-
Spring Boot
-
SQL Server
Despite sharing the same title, they have completely different skills. Unfortunately, the same issue exists across nearly every profession. Therefore, modern workforce planning requires understanding skills—not just titles. For this reason, organizations are replacing title-based planning with a skills-based workforce architecture.
How a Skills Graph Works
Mechanically, a skills graph connects multiple types of workforce information into one intelligent network. Specifically, typical connections include:
| Workforce Element | Connected To |
| Employees | Skills |
| Skills | Jobs |
| Jobs | Departments |
| Departments | Business Functions |
| Skills | Certifications |
| Skills | Learning Courses |
| Skills | Projects |
| Skills | Career Paths |
| Skills | Competencies |
| Skills | External Labor Market Data |
Ultimately, every new relationship improves the graph’s understanding of workforce capability. Furthermore, as additional employee data enters the system, recommendations become increasingly accurate.
Why Organizations Are Investing in Skills Intelligence
Currently, several workplace trends are accelerating investment in Skills Intelligence platforms.
Digital Transformation
Undeniably, technology evolves faster than job descriptions. Consequently, organizations must continuously identify emerging capabilities instead of rewriting hundreds of job profiles every year.
AI Is Changing Every Industry
Contrary to popular belief, Artificial Intelligence isn’t replacing entire jobs. Rather, it’s changing the skills required within those jobs. For example, a marketing specialist now benefits from prompt engineering. Meanwhile, a financial analyst may need automation skills. Similarly, an HR professional may use AI-powered recruiting tools. Therefore, a skills graph quickly identifies these changing relationships.
Internal Mobility Is Becoming a Priority
Naturally, hiring externally is expensive. Consequently, many organizations now prioritize internal mobility because existing employees already understand the company’s culture and operations. In this regard, a skills graph helps identify hidden talent that traditional HR systems often overlook.
Learning Investments Need Better ROI
Without a doubt, companies spend millions on training. However, without Skills Intelligence, leaders often don’t know:
-
Which programs build critical capabilities
-
Which courses improve performance
-
Which certifications increase internal promotions
Conversely, a connected skills graph links learning directly to measurable workforce outcomes.
The Core Components of a Skills Graph
Primarily, every mature skills graph includes several essential building blocks.
1. Skills Library
First and foremost, this serves as the foundation. Specifically, the library contains standardized definitions for technical skills, business skills, leadership skills, digital skills, soft skills, and industry-specific skills. Consequently, standardization eliminates duplicate entries such as “MS Excel,” “Microsoft Excel,” “Excel,” and “Advanced Excel.” Ultimately, all become one standardized skill.
2. Job Architecture
Secondly, every role links to required skills. Instead of describing jobs with long paragraphs, organizations define them through capability profiles. For example, a Cloud Engineer requires AWS, Linux, Docker, Kubernetes, Infrastructure Automation, Networking, and Security. As a result, this creates much better workforce visibility.
3. Employee Profiles
Thirdly, employee profiles include far more than resumes. In fact, they may contain previous positions, certifications, completed learning, project experience, manager assessments, self-assessments, verified competencies, and professional licenses. Moreover, the skills graph continuously updates as employees gain experience.
4. Learning Content
Fourthly, training resources become connected to the skills they develop. For instance, a Cloud Security Course builds AWS Security, IAM, Encryption, Cloud Governance, and Risk Management. Thus, the graph now understands which learning programs improve specific capabilities.
5. Career Paths
Finally, career progression becomes skill-based rather than title-based. Instead of a simple jump from Junior Developer to Senior Developer, organizations identify the missing skills needed for advancement. Consequently, employees receive personalized development recommendations.
11 Business Benefits of Using a Skills Graph
Overall, organizations that implement a skills graph gain advantages across hiring, workforce planning, employee development, and strategic decision-making.
Part 1: Core Talent Benefits
1. Better Workforce Visibility
Initially, leaders gain a real-time view of workforce capabilities instead of relying on outdated job descriptions or annual skills inventories. Furthermore, they can quickly identify where expertise exists, where shortages are emerging, and which teams possess transferable skills.
2. Faster Hiring Decisions
Consequently, recruiters move beyond keyword matching. Rather than searching only for exact job titles, they can identify candidates whose related skills make them strong matches for open positions. Ultimately, this expands the talent pool while improving hiring quality.
3. Improved Internal Mobility
Frequently, employees have valuable skills that are never reflected in their official job titles. Fortunately, a skills graph uncovers these hidden capabilities, thereby making it easier to recommend employees for new roles, stretch assignments, or cross-functional projects. As a result, this reduces external hiring costs and improves employee retention.
4. More Effective Learning and Development
Accordingly, learning programs become targeted instead of generic. Rather than assigning the same courses to everyone in a department, organizations can recommend training based on individual skill gaps and future career paths. Therefore, employees spend less time on unnecessary courses while gaining capabilities that directly support business goals.
Part 2: Strategic Workforce Benefits
5. Stronger Workforce Planning
Historically, one of the biggest challenges organizations face is preparing for future workforce needs. Typically, traditional workforce planning often focuses on headcount. While that is important, it doesn’t answer whether those employees have the right capabilities. Conversely, a skills graph shifts the conversation from “How many people do we have?” to “What skills do we have?” For example, if a company plans to launch a new cybersecurity service, leaders can quickly determine how many employees already have cybersecurity skills, which related skills can be developed through training, and whether external hiring is necessary. Thus, this allows organizations to make smarter staffing decisions.
6. Reduced Skills Gaps
Undeniably, every organization has skill gaps; however, many don’t know where they are until projects begin to fall behind. In contrast, a skills graph continuously compares current workforce capabilities against future business needs. Instead of reacting after a shortage occurs, HR and business leaders can proactively create targeted learning plans, hire for missing capabilities, and redeploy existing talent. Consequently, closing skills gaps becomes an ongoing process.
7. Better Succession Planning
Admittedly, replacing experienced employees is one of the most difficult challenges for any organization. Traditionally, succession planning usually focuses on identifying one or two potential replacements for leadership roles. However, a skills graph expands this approach by identifying employees with similar capability profiles—even if they work in different departments. For example, an operations manager may possess many of the same skills needed for a future director position. Because the graph recognizes relationships between skills, it can uncover successors who might otherwise be overlooked.
8. Smarter Project Staffing
Usually, finding the right people for projects becomes a manual process, where managers rely on memory, personal networks, or outdated spreadsheets. Fortunately, a skills graph makes project staffing far more efficient. Imagine a project requires expertise in Data Engineering, Azure, Python, Machine Learning, and Power BI. Instead of asking multiple managers who might be available, the system can instantly recommend employees whose verified skills best match the requirements. Ultimately, this saves time while increasing project success rates.
9. Improved Employee Engagement
Naturally, employees want visibility into their career opportunities. When they don’t know how to grow, engagement often declines. Conversely, a skills graph provides personalized career recommendations based on current capabilities. For instance: “You already have 80% of the skills needed to become a Data Analyst.” Subsequently, the remaining recommendations provide a clear development roadmap. Therefore, career growth feels achievable instead of uncertain.
10. More Accurate Talent Intelligence
Often, many organizations rely on incomplete workforce reports. Nevertheless, a skills graph provides a richer view by combining information from multiple sources, including HR systems, learning platforms, and performance reviews. Because all of these data points are connected, leaders can make decisions based on current workforce intelligence rather than isolated reports.
11. Better Business Agility
Undoubtedly, markets change quickly, new technologies emerge, and customer expectations evolve. Consequently, organizations that understand workforce capabilities can adapt much faster than those relying on static job descriptions. Specifically, a skills graph enables leaders to answer if they can support a new product launch or if they have enough AI talent. Ultimately, agility becomes a measurable business capability.
How AI Makes a Skills Graph Even Smarter
In recent years, Artificial Intelligence has significantly improved the value of Skills Intelligence. Specifically, modern AI systems help organizations extract skills from resumes, analyze job descriptions, recommend learning paths, and predict future skill demand.
Instead of manually updating thousands of skill records, AI continuously refines the graph as new information becomes available. For example, if a new technology gains widespread adoption, AI can recognize that related certifications, learning courses, and job postings increasingly reference that skill. Consequently, the graph evolves automatically rather than waiting for manual updates.
Skills Graph vs. Skills Taxonomy
Frequently, these two terms are often confused. Although they work together, they nevertheless serve different purposes.
| Feature | Skills Taxonomy | Skills Graph |
| Structure | Organizes skills into categories | Connects skills through relationships |
| Nature | Static structure | Dynamic network |
| Function | Defines terminology | Explains relationships |
| Grouping | Groups similar skills | Links people, jobs, learning, and skills |
| Application | Easier to build | More powerful for decision-making |
In summary, think of a taxonomy as a well-organized library catalog. Conversely, a skills graph is like an interactive map showing how every book, author, subject, and reader is connected.
Common Data Sources Used in a Skills Graph
Building an effective skills graph requires more than employee resumes. Therefore, organizations typically combine data from multiple systems. Specifically, common sources include:
-
Human Resources Information Systems (HRIS): Namely, these systems provide job titles, departments, and employment history.
-
Applicant Tracking Systems (ATS): Furthermore, recruiting platforms contribute candidate resumes, interview evaluations, and hiring outcomes.
-
Learning Management Systems (LMS): Similarly, learning platforms identify completed courses, certifications, and assessment results.
-
Performance Management Systems: Moreover, performance reviews often reveal demonstrated competencies and development priorities.
-
Project Management Platforms: Additionally, project work provides evidence of real-world skills. For example, Agile delivery or Scrum leadership. Consequently, verified project experience often provides stronger evidence than self-reported skills.
-
External Labor Market Data: Finally, many organizations enrich their skills graph using external information such as job postings and salary benchmarks. Ultimately, this helps organizations compare internal capabilities with market trends.
Common Challenges & Best Practices
Challenges
Although the benefits are significant, nevertheless, implementation requires careful planning.
-
Inconsistent Skill Names: For instance, different departments often use different terms for the same capability. Without standardization, reporting becomes inaccurate.
-
Outdated Employee Profiles: Since skills change constantly, if employee profiles aren’t updated regularly, the graph loses value.
-
Too Much Manual Data Entry: Admittedly, employees dislike lengthy self-assessments. However, modern platforms reduce manual work by automatically gathering data.
-
Lack of Business Ownership: Crucially, a skills graph should not be treated as an HR-only initiative. Instead, successful programs involve cross-functional ownership.
Best Practices
Generally, organizations that achieve the best results consequently follow these practices:
-
Start with Business Goals: Initially, avoid building a skills graph simply because the technology is available. Instead, begin by asking what workforce problems need solving.
-
Create a Common Skills Language: Specifically, establish standardized skill definitions and naming conventions.
-
Validate Skills with Multiple Sources: Importantly, don’t rely on self-reported information alone. Rather, combine evidence from certifications, learning completions, and performance reviews.
-
Keep the Graph Current: Ultimately, a skills graph should be treated as a living system. Therefore, automate updates wherever possible.
The Future of Skills Intelligence
Undeniably, the workplace is changing faster than ever. Simultaneously, artificial intelligence is automating routine work, and new technologies appear every year. Consequently, as these changes continue, organizations can no longer rely on static job descriptions. Instead, they need a living system that continuously reflects how work is actually performed.
This is why the skills graph is becoming a foundational part of modern workforce strategy. Rather than asking, “What job does this employee have?” organizations are now beginning to ask:
-
What can this employee do?
-
What could they learn next?
-
Which projects fit their capabilities?
-
Which future roles are within reach?
Ultimately, this shift creates a workforce that is more flexible, more engaged, and better prepared for change.
Emerging Trends in Skills Graph Technology
Moving forward, I expect several developments to shape the next generation of Skills Intelligence platforms.
-
AI-Powered Skill Discovery: Soon, AI will become even better at identifying skills from everyday work. Instead of relying only on resumes, systems will recognize skills from project contributions and code repositories.
-
Dynamic Job Architecture: Gradually, traditional job descriptions will disappear. Instead, organizations will maintain dynamic job profiles that automatically adjust.
-
Personalized Career Navigation: In the future, employees will receive recommendations similar to those provided by streaming platforms. Consequently, career development becomes personalized instead of generic.
-
Skills-Based Compensation: Increasingly, many organizations are beginning to reward verified capabilities rather than seniority alone. Therefore, a skills graph provides objective evidence that supports these decisions.
-
Better Workforce Forecasting: Moreover, organizations are moving from reactive workforce planning to predictive planning. Consequently, a skills graph helps answer future demands with far greater confidence.
How to Measure Success
Crucially, implementing a skills graph is not the finish line. Therefore, organizations should also measure whether it delivers meaningful business value. Specifically, common performance indicators include internal mobility rates, time to fill open positions, critical skill coverage, and project staffing speed. Ultimately, tracking these metrics helps leaders demonstrate the return on investment.
Final Thoughts from a Consultant
In conclusion, the organizations that succeed over the next decade will not necessarily have the largest workforce. Rather, they will have the clearest understanding of their workforce. Indeed, a well-designed skills graph gives leaders a shared view of how people, skills, jobs, learning, and business needs connect. Consequently, that visibility leads to better hiring decisions, stronger workforce planning, more effective learning investments, and greater internal mobility.
However, technology alone is not enough. Furthermore, successful organizations also invest in clear job architecture, standardized skill definitions, strong data governance, and continuous skills validation. When these elements work together, ultimately, a skills graph becomes the foundation for a true skills-based organization.
Therefore, for organizations beginning their journey, start small. First, build a clean skills taxonomy. Next, connect it to your job architecture. Finally, expand over time. Ultimately, a well-governed, continuously updated skills graph will deliver far more long-term value than a large but outdated inventory.
Frequently Asked Questions (FAQ)
What is a skills graph?
Essentially, a skills graph is a connected network that links employees, skills, job roles, certifications, learning content, projects, and business capabilities. Consequently, it helps organizations understand workforce skills and how they relate to work.
How is a skills graph different from a skills taxonomy?
Primarily, a skills taxonomy organizes skills into categories. Conversely, a skills graph goes further by showing the dynamic relationships between skills, people, and jobs.
Why is a skills graph important?
Ultimately, it helps organizations make better decisions about hiring, employee development, succession planning, and internal mobility by providing a complete view of capabilities.
Can AI build a skills graph?
Yes, indeed. Modern AI can extract skills from resumes, job descriptions, and learning records. Furthermore, AI helps identify related skills and keeps the graph updated as business needs change.
Is a skills graph only for large enterprises?
No, certainly not. Small and medium-sized organizations can also benefit. Even a basic skills graph helps identify hidden talent and support internal promotions without requiring a massive HR technology investment.
How often should a skills graph be updated?
Ideally, it should be updated continuously. Therefore, automated integrations with HR systems and learning platforms help ensure that workforce skills remain current instead of becoming outdated.
Recommended Reading & Industry Sources
To further explore skills intelligence, skills graphs, and the shift toward skills-based organizations, check out these highly authoritative industry deep-dives and blog posts:
-
Deloitte
Skills Framework & Skills-Based Organization Agility
An excellent breakdown of how organizations are moving away from static, competency-based talent management toward dynamic skills frameworks like ontologies and skills graphs.
-
Lightcast
The Lightcast Open Skills Taxonomy
A detailed look into how open-source libraries of tens of thousands of skills are being categorized and utilized to create a common language between employers and the labor market.
-
Gloat
Skills Intelligence: The Key to Workforce Planning
A high-quality blog post exploring how skills intelligence tools bring all organizational data into one place, enabling agile internal mobility and project-based work without relying on job titles.
-
Fuel50
What Is A Skills-Based Organization? [Complete Guide]
A comprehensive guide detailing how shifting to a skills-based architecture improves retention, innovation, and overall business agility.
-
Organisation for Economic Co-operation and Development (OECD)
Authoritative research and insights on how artificial intelligence is reorganizing tasks and shifting the demand for both specialized and common skills in the modern labor market.
-
GoMeasure AI
A practical look at how living capability maps are built from verified evidence (rather than just self-reported data) to power succession planning and hiring.